How reliable is your internet connection? Do you often experience drop outs?
In this node-red project we will create a Node-Red dashboard to monitor your Internet connection and log outages.
The standard way of testing your internet connection is to use the ping command.
The ping command is run from the command line and can be set to run continuously.
The problem with this manual method is that it doesn’t log results and so you would need to continuously watch the command console.
However we can combine the ping command with node-red and use node-red to log the results either to a file or database or both.
There are several ping nodes available I used the configurable ping node because it allows you to change the ping host by passing the host into the node.
How it Works
It pings a host (8.8.8.8 – Google DNS) every 10 seconds. The timing is set by the inject node.
If the ping fails it could indicate a internet connection failure or alternatively a problem with the host 8.8.8.8.
Therefore it pings two other hosts. If both of these pings fail it records a failure an if one or both succeed it doesn’t record a failure.
When in the failure condition it continues to ping 8.8.8.8 and as soon as it succeeds the failure period is over and the duration is logged.
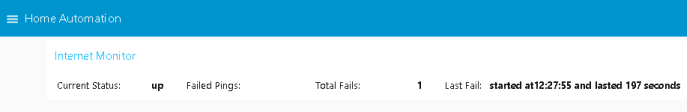
A screen shot of the dashboard is shown below.
What needs to be changed
Ping period -changed in the inject node labelled- set ping period.
Main Host to ping – Changed in the function node main host to ping.
var good_host=”8.8.8.8″;
Secondary hosts– changed in the function node Secondary hosts to ping
var good_host1=”208.67.222.222″;
var good_host2=”www.ionos.co.uk”;
Display frequency – Set in the inject node labelled display frequency. Default 2 seconds
Notes: The flow includes inject nodes used for testing and I have left them in. You can simulate a failure of main host using the inject node fault1 on and to toggle use fault1 off.
Likewise with the secondary hosts use fault2
Flow Download

Video- Monitoring Your Internet Connection
Suggestions
This is effectively version1 of the dashboard. I will be adding database and or file logging in the future and welcome suggestions using the comments form.
Related Tutorials and resources
- Using The Ping Command – Home Networking Testing
- Controlling the Tasmota SonOff Switch with Node-Red
- Monitor Internet Speeds with Speedtest-cli and Node-Red
Great utility, thank you – how can I add the date to the displayed time that the ping failed? ( i.e modification to the Display results in line 28)
Yes you need to modify the convert time function.
I am making major modifications to the tool and you may want to wait a few days .
I have updated it now and it shows history and date
Rgds
Steve